Logistics · Fleet Operations
Routiq — A Digital Ecosystem for Waste Operations
An in-house platform for a waste-management company — unifying scheduling, driver routes, fleet monitoring, and customer apps, replacing a stack of third-party tools.

Role
Research, Wireframes,
Design System,
Dev Handoff
Team
3 Product Designers,
1 Creative Director
2 Product Managers,
18 Engineers
Duration
6 Months
Background & Problem
Routiq's operations ran on a patchwork of third-party platforms — inflexible, inefficient, and hard to evolve. They brought us in to build a connected, in-house ecosystem they could actually own and grow.

Routiq was several interconnected products. I owned two: the Fleet Monitoring platform and the Customer app. This case study focuses on Fleet Monitoring — designing real-time operational visibility for teams managing live fleets
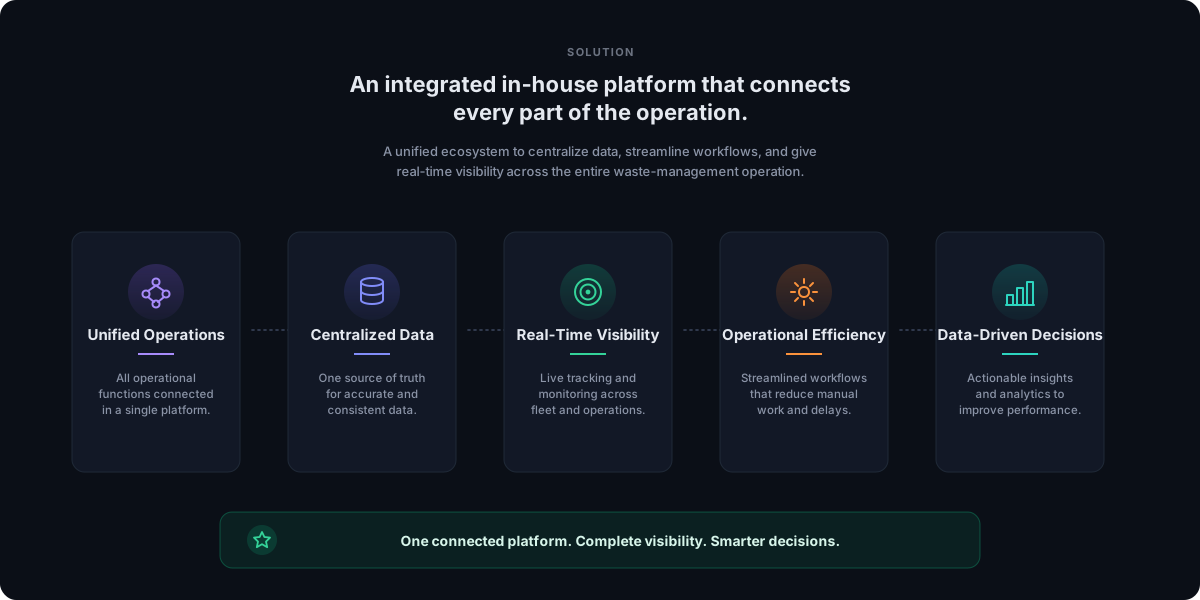
Solution
A scalable in-house ecosystem designed to unify fleet visibility, streamline operations, and improve real-time decision-making.
Design Goals
Real-Time Fleet Visibility
Track vehicle movement, routes, and stop status live.
Map-First Operational Experience
Built around the map, so teams read fleet status at a glance.
Scalable Fleet Visualization
Smart clustering that hides detail when zoomed out, reveals it when zoomed in.
Fleet Monitoring Solution
Smart Map Clustering
Dynamic clustering keeps the map readable when zoomed out, reveals individual vehicles when zoomed in.

Contextual Vehicle Insights
Key vehicle info opens right from the map — no digging through menus to monitor a vehicle.


Historical Route Playback
Replay any vehicle's route, live or up to 30 days back, for analysis
and incident investigation.


Vehicle Health Monitoring
Real-time vehicle health surfaced proactively, before small issues
become breakdowns.

Driver Event Monitoring
Driver events and alerts in one place, so teams catch incidents
and respond faster.


Outcome & Reflections
What it delivered
A single map-driven interface for live fleet monitoring — routes, driver events, and vehicle health in one view, built to scale to large operations.
What I took from it
Designing data-heavy, real-time operational tools is its own discipline — the challenge isn't adding information, it's keeping a dense, live map readable under pressure. That constraint shaped every screen.